
Projects completed by Aesir
Data analysis for Sustainable Water Infrastructure Group water filtration column test
It is important to remember that computer models are tools built to assist in understanding or predicting a complex system. This is true whether the system is physical like glacial flow dynamics, or economic like the United States energy economy. With this in mind we were hired to assess the capability of different national energy models to resolve the greenhouse gas (GHG) impact of individual mining leases. Our analysis included the level of transparency of the model as well as the ability of the model to resolve the problem. Most national energy models are proprietary, making external validation and model transparency unattainable for small orginazations. Because it is an open-source model developed by the US Energy Information Administration, we focused on the ability of the National Energy System Model (NEMS) to solve this problem. We found that the NEMS is likely suited to solving this problem without modification if the individual mine produced a significant percentage of the total coal produced in the geographic region in question. Our analysis was based both on published papers and data as well as direct analysis of the uncompiled source code. We further determined that with minor modifications, the NEMS could be the standard for assessing the GHG impact of mining leases nationwide.
This work was conducted in conjunction with Power Consulting Inc. for Earthjustice and the Sierra Club.
This work was conducted in conjunction with Power Consulting Inc. for Earthjustice and the Sierra Club.
Assessing national energy/economic models
It is important to remember that computer models are tools built to assist in understanding or predicting a complex system. This is true whether the system is physical like glacial flow dynamics, or economic like the United States energy economy. With this in mind we were hired to assess the capability of different national energy models to resolve the greenhouse gas (GHG) impact of individual mining leases. Our analysis included the level of transparency of the model as well as the ability of the model to resolve the problem. Most national energy models are proprietary, making external validation and model transparency unattainable for small orginazations. Because it is an open-source model developed by the US Energy Information Administration, we focused on the ability of the National Energy System Model (NEMS) to solve this problem. We found that the NEMS is likely suited to solving this problem without modification if the individual mine produced a significant percentage of the total coal produced in the geographic region in question. Our analysis was based both on published papers and data as well as direct analysis of the uncompiled source code. We further determined that with minor modifications, the NEMS could be the standard for assessing the GHG impact of mining leases nationwide.
This work was conducted in conjunction with Power Consulting Inc. for Earthjustice and the Sierra Club.
This work was conducted in conjunction with Power Consulting Inc. for Earthjustice and the Sierra Club.
Determining economic value of the Glen Canyon Dam
With heightened drought conditions in the Upper and Lower Colorado Basins, the future water level of the Glen Canyon and Hoover Dams are likely to continue dropping. If this trend in lowering water levels continues, power production at the dams will eventually not be possible. We conducted a thorough assessment of the economic value of the current power generation at Glen Canyon Dam as well as an analysis of the impact on the electrical grid in the western United States and an assessment of the ability of other power producers to offset the potential loss of power production at Glen Canyon Dam.
This work was conducted in conjunction with Power Consulting Inc. for the Glen Canyon Institute. The results of this study are not yet publicly available.
This work was conducted in conjunction with Power Consulting Inc. for the Glen Canyon Institute. The results of this study are not yet publicly available.
Data mining from USPTO records
In late 2014, Aesir was asked to help gather statistical data on patents that were granted between 1992 and 2006. To gather this data, Aesir searched patent applications that were submitted between 1987 and 2007 parsing data from more than 2.75 million patent applications, taking about 5.5 months of CPU time. The final result of this data mining project was that over 400,000 of the US Patents parsed by Aesir Consulting LLC had the required full set of data for patents granted between 1992 and 2006. The aggregated data include patent number, patent application number, Mail Notice of Allowance Date, Patent Issue Date Used in PTA Calculation, Issue Notification Mailed Date, Initial Exam Team nn Date, and Issue Fee Payment Received Date.
**This data is available for purchase. Also similar data aggregation is possible, contact us for more details**
**This data is available for purchase. Also similar data aggregation is possible, contact us for more details**
Measuring water content of ice in the ablation zone of the Greenland Ice Sheet with inversion of GPR data constrained by borehole measurements
|
Georadar (also called Ground Penetrating Radar, GPR, or Ice penetrating radar when it is used to image the cryosphere) is commonly used to infer spatially and temporally changing accumulation rates in Greenland and Antarctica. We constructed a GPR system that we used to collect common offset and multi-offset data over difficult terrain (see picture) in the abaltion area of the western Greenland Ice Sheet, specifically upstream (~27 km) of the terminus of the ground-terminating outlet glacier, Isunngua Sermia. We use a suite of geophysical processing applications to determine the velocity of the GPR signal through the ice, this velocity is related to the ratio of water to ice throughout the ice column. We found a surprisingly high percentage of liquid water is held within the ice, with the highest percentage of liquid water content occurring near the bed of the ice sheet in a temperate layer. This liquid water creates "wet" ice that has a much lower viscosity than its dry counterpart. The implications of this finding include higher flow rates than full ice sheet models currently predict as well as overestimation of ice sheet volumes in the regions with this high liquid water content (~4%). Interestingly, ~5 km further upstream from where we find "wet" ice, the ice no longer has a wet, temperate layer.
|
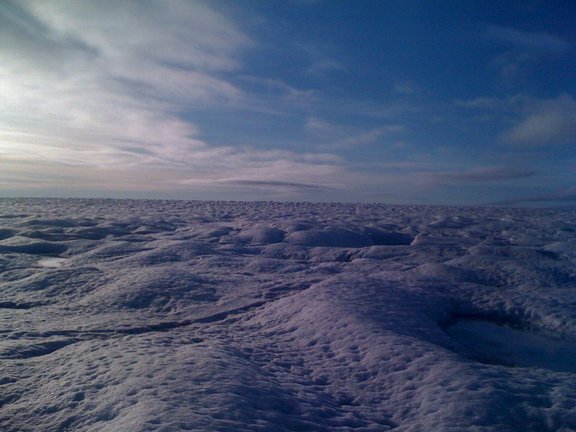
Ice hummocks, melt streams, and melt ponds create difficult terrain for GPR. The hummocks in this photo of our field site are about 1-2 m high.
|
This is a short visualization showing the relative positions of three radar profiles collected in the ablation zone of the Greenland Icesheet along with six boreholes drilled to the ice/ground interface. The two longer radar profiles were collected by the Center for Remote Sensing of Ice Sheets (CReSIS) in 2011 for Operation IceBridge, the intersecting radar profile was collected by Dr. Brown for the University of Montana (UM) in 2012. Interpretations of the bed are shown in magenta (IceBridge data) and red (UM data). Borehole locations and depths are shown as vertical green lines. Note that the IceBridge bed and the UM bed do not line up one one side of the UM profile. The borehole depths in that region suggest that the IceBridge radar does not penetrate to the bed of the ice. One possible explanation for this inconsistency in the data is that the high frequencies used in the IceBridge data cannot penetrate the high water content ice in the basal temperate layer. The GPR profiles are hung off of the measured surface elevation along the profiles. Ice depth is calculated with a wave velocity of 1.68 x 10^8 m/s, this is a commonly assumed velocity of EM waves in glacial ice, however, our research shows that the water content of the ice lowers this average velocity to ~1.60 x 10^8 m/s in this region.
* Note that the IceBridge data are ~17 km in length wherein the UM data cover ~800 m.
Citation for the IceBridge data:
Leuschen, C. 2014, updated 2015. IceBridge MCoRDS L1B Geolocated Radar Echo Strength Profiles, Version 2. 20110413_02_002 and 20110413_02_006. Boulder, Colorado USA. NASA National Snow and Ice Data Center Distributed Active Archive Center. doi: http://dx.doi.org/10.5067/90S1XZRBAX5N. accessed on 8/9/2016
**Data processing and visualization were performed in MatLab under the license owned by the University of Montana.
Constraining depth/density profiles in firn through optimization of common offset GPR
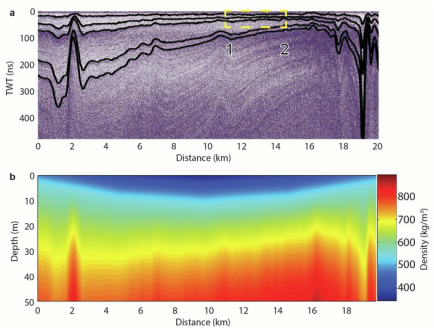
a) A 400 MHz radar profile with layer picks. b) The inverted density profile for the firn column.
|
Current methods for inverting for accumulation are based on the (necessary) assumption that firn depth/density profiles are consistent across large regions. This assumption is incorrect and can lead to errors in estimated accumulation of more than 10%. This error is enhanced when the accumulation estimates are used to determine the surface mass balance of ice sheets over large areas. Currently we are working on a method of calculating the depth/density profile of dry firn columns by finding the best-fit (optimized) solution between georadar derived data and a series of empirical equations which relate the density profile of firn to georadar measurements.
An example calculated firn density profile is shown at left. |
Aesir was hired by the Norwegian Polar Institute to conduct this research.
***Please contact us if you would like to hire Aesir for any glaciological study.***
***Please contact us if you would like to hire Aesir for any glaciological study.***
|
|
|